


About this image
Global Strategy Executive Dashboard
AI model
 gemini-3.1-flash-image
- Dimension
- 16:9 (1376 × 768)
- Resolution
- 1K
Prompt
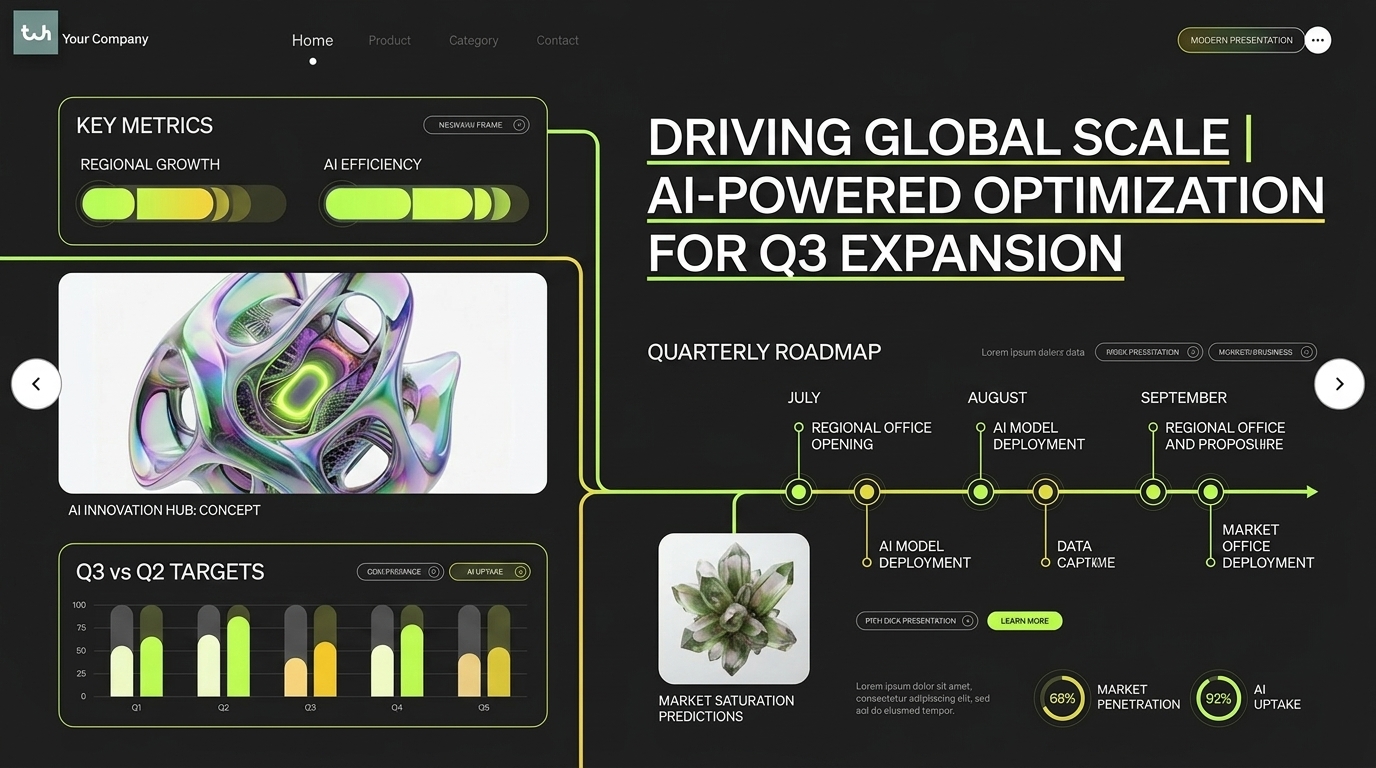
Corporate pitch deck presentation slide layout: 'Q3 Global Market Expansion & AI Strategy'. Structured analytical executive slide featuring segmented neon KPI metric cards, a quarterly roadmap timeline with connected circular milestone nodes, and a clean data infographic comparison chart against a dark matte background.
Creative summary
The image presents a sleek, modern, digital-style corporate dashboard or presentation slide with a dark theme. The background is a solid, deep, matte charcoal grey. Across the interface, there are various graphical elements in a consistent aesthetic of neon green and white, with thin, precise lines. In the upper left corner, there is a header section titled "KEY METRICS," which contains two rectangular data cards featuring glowing horizontal progress bars that fade from neon green to a softer yellow-green gradient. Below this, on the left, is a visual feature box displaying an abstract, iridescent, 3D-rendered organic shape with a metallic, multi-colored finish reminiscent of oil on water, featuring swirling shades of pink, teal, and lime. Beneath that is a "Q3 vs Q2 TARGETS" area with a vertical bar chart. On the right side of the layout, a large, bold title occupies the upper quadrant. Below this is a "QUARTERLY ROADMAP" timeline that stretches horizontally, marked by small, connected, neon green circular nodes along a solid line. Some nodes contain labels. To the right, another rectangular card displays a 3D-rendered, cactus-like succulent plant. At the bottom right corner, there are two circular gauge-style percentage indicators with neon green rings. Throughout the slide, there is various placeholder text in a crisp, sans-serif white font, arranged in organized columns and rows. The entire layout is structured with thin green lines that serve as visual connectors between the sections, giving it a high-tech, analytical appearance. Navigation arrows are located on the far left and far right edges of the composition. The overall mood is sophisticated, professional, and data-driven, with a focus on technological advancement and strategic planning.
Made with JammyJar
Create your own with JammyJar