


Об изображении
SolaraGrid Intelligent Energy Orchestration
AI-модель
 gpt-image-2
- Размер
- 16:9 (1280 × 720)
- Разрешение
- 1K
Промпт
High-fidelity desktop marketing website hero section for 'SolaraGrid' - an AI-driven smart renewable energy grid orchestrator. Ultra-dark charcoal backdrop (#121316) energized with electric sunburst orange (#FF7A00) and golden solar yellow (#FFD600) accents. Impactful headline: 'Zero-Waste Energy Grids in Real Time' with primary CTA 'Deploy Solara Node'. The hero visual displays an interactive 3D isometric city grid with live power routing flows, battery storage load bar charts, solar capture efficiency radial dials, and carbon offset KPI badges. High informational density, hyper-clean vector graphics.
Описание
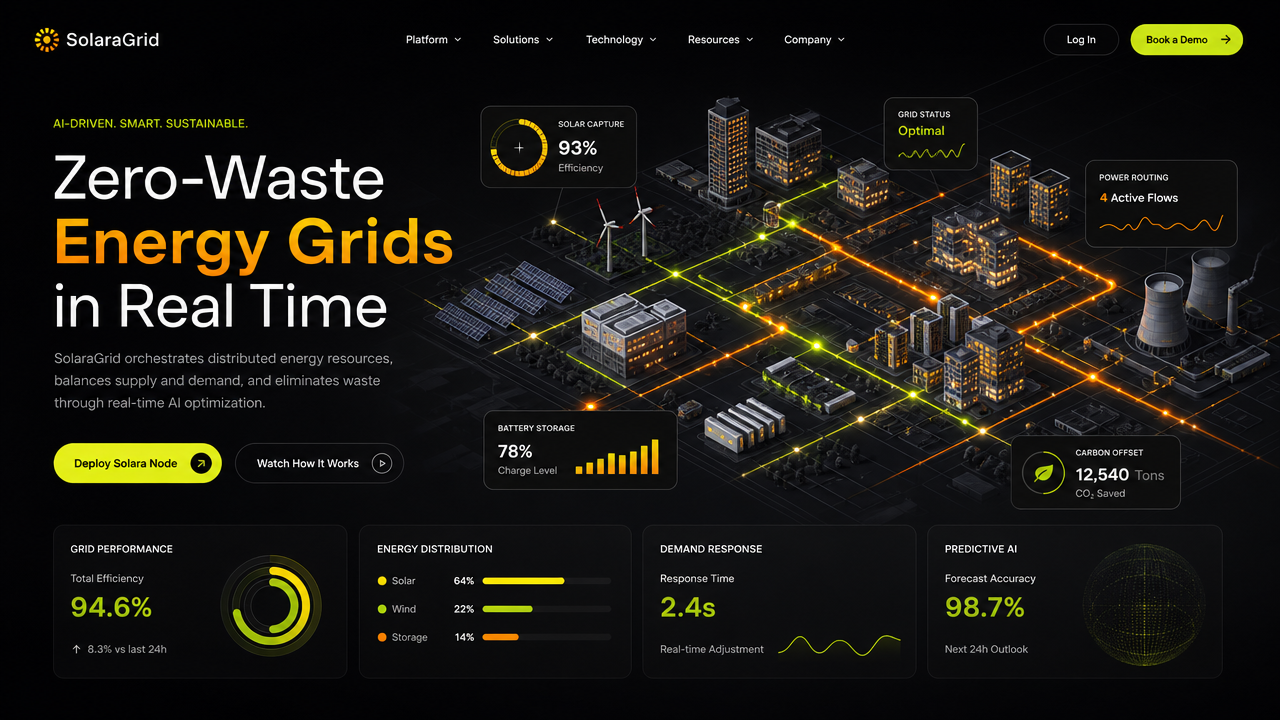
A high-fidelity digital marketing website landing page rendered on an ultra-dark charcoal background (#121316). The page layout features a main hero section with a headline written in a sans-serif, bold font, blending white and vibrant orange text. Below the headline sits a descriptive paragraph and two primary action buttons: one bright yellow with an arrow icon and one with a transparent dark outline. The central focus of the page is a complex, isometric 3D render of a futuristic smart city grid. This cityscape includes detailed buildings, wind turbines, solar panels, and cooling towers, all connected by glowing, electric sunburst orange and golden solar yellow lines representing energy flow. Several UI cards float over and around the isometric city, featuring data visualizations like donut charts, line graphs, bar charts, and numerical statistics. These cards have dark translucent backgrounds with soft, rounded corners and thin borders. The bottom section of the page is organized into a horizontal row of four distinct dark informational panels, each displaying metrics about grid performance, energy distribution, demand response, and predictive AI, utilizing line graphs, dot indicators, and bold yellow-green text to display numerical values like percentages and times. The color palette relies heavily on the dark charcoal base, contrasted sharply by bright yellow, vibrant orange, and muted white, with accents of pale yellow-green for the data points. The overall aesthetic is sleek, tech-focused, and professional, mimicking a high-end dashboard interface, with crisp lines, soft glow effects on the energy paths, and a clean, organized, data-dense layout. Text is present throughout the interface, positioned as titles, labels, and paragraph copy for the various UI elements described.
Сделано в JammyJar
Создайте своё в JammyJar