


À propos de cette image
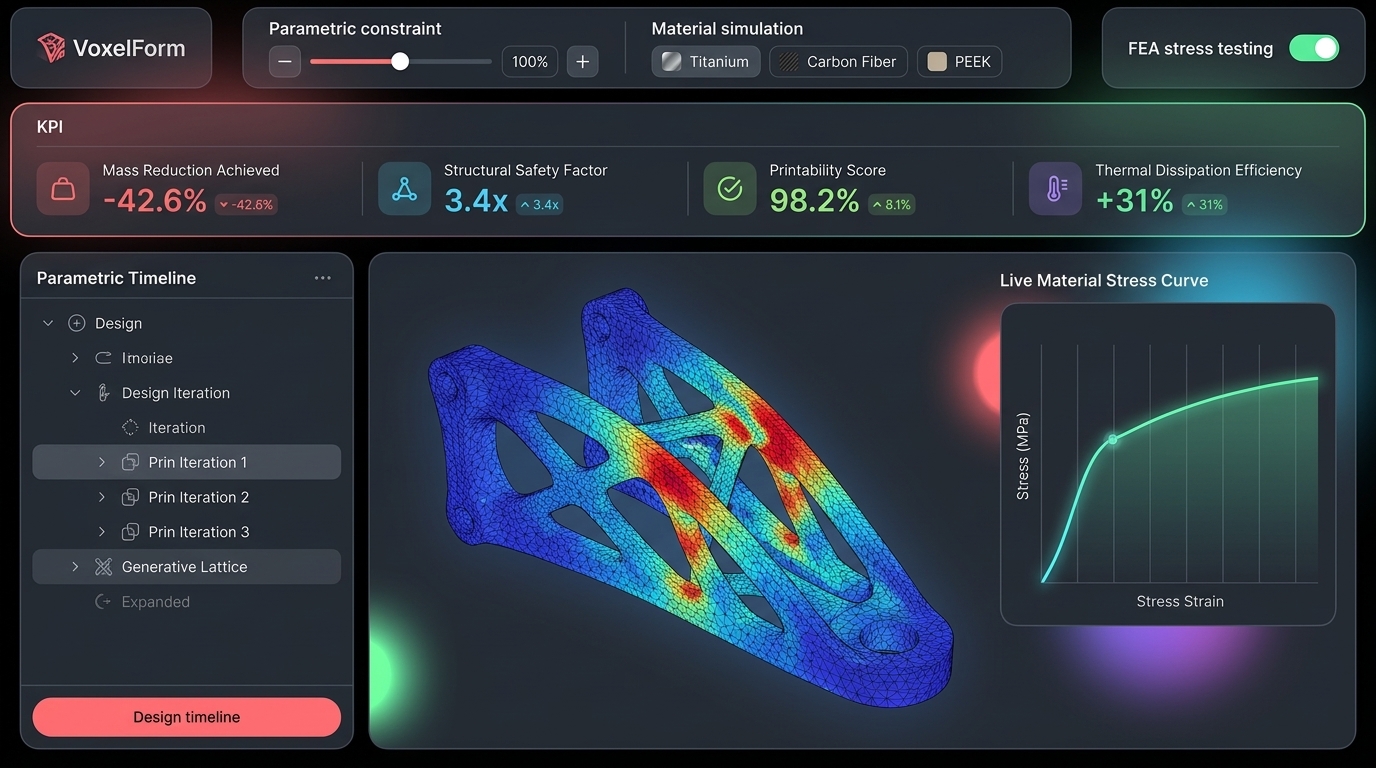
VoxelForm Industrial Engineering Interface
Modèle d'IA
 gemini-3-pro-image
- Dimension
- 16:9 (1376 × 768)
- Résolution
- 1K
Prompt
High-fidelity desktop SaaS marketing website hero interface for 'VoxelForm' (/workspace/generative-cad), a cloud-native generative 3D industrial engineering and generative CAD tool. Sleek dark-mode slate background (#14161C) with vibrant cobalt blue #2979FF and neon citrus accents. Top toolbar with parametric constraint controls, material simulation presets (Titanium, Carbon Fiber, PEEK), and FEA stress testing toggle. Top KPI bar shows: 'Mass Reduction Achieved' (-42.6%), 'Structural Safety Factor' (3.4x), 'Printability Score' (98.2%), and 'Thermal Dissipation Efficiency' (+31%). Main canvas features a high-density 3D generative lattice bracket with stress heatmap color gradients (blue to red FEA mesh), flanked by a parametric timeline tree and a live material stress-strain curve on the right. Modern industrial design software UI, razor-sharp rendering, precise geometry, clean typography.
Résumé créatif
The image is a high-fidelity interface for a cloud-native generative 3D engineering tool, presented on a dark-mode slate grey background with subtle, soft-focus ambient light glows in red, green, blue, and purple at various points in the peripheral areas. The layout is structured as a dashboard. At the top left, there is a brand logo block followed by a horizontal control bar featuring sliders for parametric constraints, material selection buttons (Titanium, Carbon Fiber, PEEK), and a toggle switch for FEA stress testing. Below this is a horizontal KPI dashboard containing four metrics showing percentage changes and values in bold white and green. The main central area is divided into two panels. The left panel is a vertical sidebar with a collapsible hierarchical tree structure labeled 'Parametric Timeline', featuring icons and text labels for design iterations and a lattice element, concluding with a large red button at the bottom. The central panel displays a 3D isometric render of a generative engineering bracket, covered in a finite element analysis mesh overlay that transitions in color from blue to green to yellow and red to represent stress levels. To the right of the bracket is a 'Live Material Stress Curve' graph, showing a luminous mint-green curved line plotting stress versus strain against a dark grid. The entire interface utilizes a modern, rounded-corner aesthetic with semi-transparent, frosted-glass-like dark panels. The color palette relies heavily on the #14161C slate background, contrasted by clean white typography, bright cyan and neon green highlights for data, and the vibrant heat-map spectrum (blue, yellow, orange, red) on the 3D model. There are various pieces of UI text throughout the frame, including labels and numerical data, all rendered in a clean, sans-serif, system-style font.
Créée avec JammyJar
Créez la vôtre avec JammyJar