


À propos de cette image
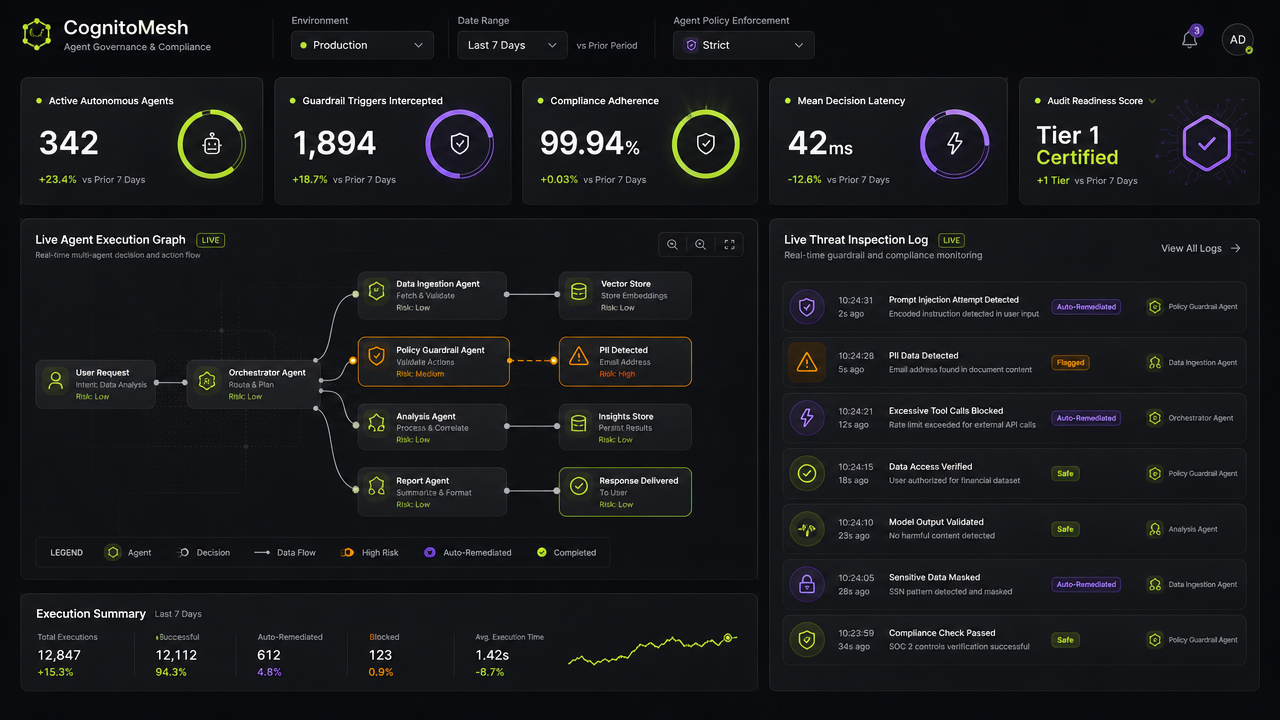
CognitoMesh Governance Dashboard
Modèle d'IA
 gpt-image-2
- Dimension
- 16:9 (1280 × 720)
- Résolution
- 1K
Prompt
High-fidelity desktop SaaS marketing hero section interface for 'CognitoMesh' (/governance/audit-stream), an autonomous AI agent fleet governance and compliance platform. Deep graphite matte UI (#111216) with vibrant amber orange #FF9900 and electric violet accents. Top navigation bar with active environment switcher, date range selector (Last 7 Days vs Prior Period), and agent policy enforcement filter. Top row contains 5 KPI stat cards: 'Active Autonomous Agents' (342), 'Guardrail Triggers Intercepted' (1,894), 'Compliance Adherence' (99.94%), 'Mean Decision Latency' (42ms), and 'Audit Readiness Score' (Tier 1 Certified). Main view features an interactive real-time multi-agent execution DAG graph on the left, showing node decision steps, and a live threat inspection log feed on the right with color-coded risk tags (Safe, Flagged, Auto-Remediated). High informational density, sleek dark mode aesthetics, crisp vector lines.
Résumé créatif
This is a digital interface screenshot of a high-fidelity SaaS dashboard presented in a dark-mode theme. The background is a uniform deep graphite gray, establishing a sleek, professional aesthetic. The layout is organized into distinct grid-based panels. At the very top, a navigation bar holds a logo and dropdown menus for environment and policy settings, alongside a notification icon and user avatar. Below this header, a row of five individual metric cards displays quantitative data with corresponding circular progress rings in lime green, violet, and amber hues. The largest section occupies the center-left: a flow chart depicting a 'Live Agent Execution Graph,' composed of interconnected nodes and lines that trace processes from a user request through various specialized agent stages, using icons to represent different data processing steps. On the right side, a vertical list serves as a 'Live Threat Inspection Log,' presenting timestamped events, each marked with color-coded status badges in violet, amber, and green, indicating the nature of the activity. Across the bottom of the interface, a horizontal 'Execution Summary' panel provides high-level aggregated data including counts, percentages, and a small line graph showing a trend line in a bright chartreuse color. The color palette relies heavily on the dark graphite background, accented by vibrant, high-contrast neon colors: electric violet for alerts and specific status indicators, lime green for success and positive metrics, and amber-orange for warnings or high-risk items. Text is presented in a clean, sans-serif, monospaced-style font, appearing in varying weights and sizes to establish a visual hierarchy. The entire interface has a clean, flat-design rendering style with subtle drop shadows on the cards to create depth, giving the impression of a modern, sophisticated enterprise analytics platform.
Créée avec JammyJar
Créez la vôtre avec JammyJar